Related article: Th1 Spectrum Disorder

Table of Contents
Incidence and prevalence of chronic disease
The last half century has seen a steady increase in the incidence and prevalence of chronic inflammatory diseases with further increases expected. According to the Marshall PathogenesisA description for how chronic inflammatory diseases originate and develop., a number of factors are to blame:
- misuse of antibiotics especially Beta-lactam antibiotics
- vitamin supplementation including folic acid but especially vitamin D
- presence of environmental factors which suppress immunity
- novel vectors for sharing pathogens including blood donation
- widespread adoption of compulsory mass vaccinations
Historical increases in the prevalence of certain chronic diseases
Manifestations of both arteriosclerosis1) 2) and cardiac disease3) can be observed in mummies of ancient Egypt. Ötzi the Neolithic Iceman who lived around 3300 BC was found to have arthritis.4) Yet, it is only recently that rates of certain chronic diseases have appeared to escalate.
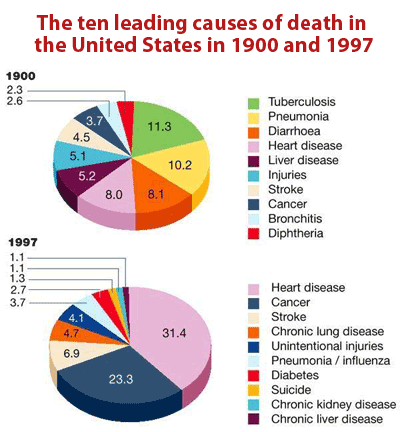
At the beginning of the twentieth century, infectious diseases were the leading cause of death worldwide. In the United States, three diseases — tuberculosis, pneumonia, and diarrhoeal disease — caused 30% of deaths.5) By the end of the twentieth century, in most of the developed world, mortality from infectious diseases had been replaced by mortality from chronic illnesses such as heart disease, cancer and stroke.6)
According to a recent Nature paper there were 36 million deaths from “noncommunicable diseases” in 2008, or 63% of all deaths worldwide.7)
While many researchers have argued8) 9) that most chronic diseases are not caused by infection, a broad array of evidence suggests otherwise.
Current prevalence of chronic disease in the United States
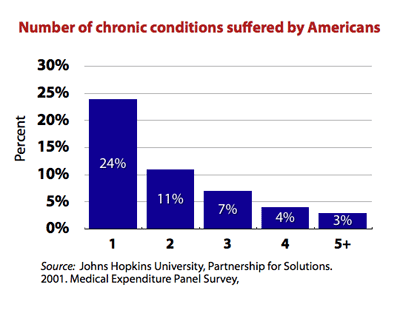
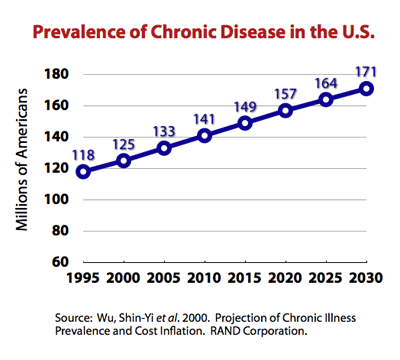
In 2000*, approximately 125 million Americans (45% of the population) had chronic conditions and 61 million (21% of the population) had multiple chronic conditions.10)
According to the 2004 report:
In 2004, almost half of all Americans, or 133 million people, live with a chronic condition. … People with chronic conditions account for 83 percent of health care spending and those with five or more chronic conditions have an average of almost fifteen physician visits and fill over 50 prescriptions in a year.
Partnership for Solutions National Program Office, Robert Wood Johnson Foundation
The rate of chronic health conditions among children in the United States increased from 12.8% in 1994 to 26.6% in 2006, particularly for asthma, obesity, and behavior and learning problems, according to results of a new prospective study published in the 2010 paper in Journal of the American Medical Association.11)
* the May, 2017 Rand Corporation study estimated of Americans (USA) in 2014:- 60% had one and 42% had multiple chronic conditions
in Chapter One: Prevalence of Multiple Chronic Conditions
Chapter Two: Health Service Use and Spending
Chapter Three: Functional Status of Adults with Multiple Chronic Conditions
Multimorbidity
According to a 2012 JAMA paper, the most common chronic condition experienced by adults is multimorbidity, the coexistence of multiple chronic diseases or conditions.12) In patients with coronary disease, for example, it is the sole condition in only 17% of cases.13) Almost 3 in 4 individuals aged 65 years and older have multiple chronic conditions, as do 1 in 4 adults younger than 65 years who receive health care.14) Adults with multiple chronic conditions are the major users of health care services at all adult ages, and account for more than two-thirds of health care spending.15)
A Dutch survey of 212,902 patients' records found the following:16)
- Multimorbidity of chronic diseases was found among 13% of the Dutch population and in 37% of those older than 55 years.
- Among patients over 55 years with a specific chronic disease more than two-thirds also had one or more other chronic diseases.
- Most disease pairs occurred more frequently than would be expected if diseases had been independent. Comorbidity was not limited to specific combinations of diseases; about 70% of those with a disease had one or more extra chronic diseases recorded which were not included in the top five of most common diseases.
A separate Dutch analysis found that the prevalence of chronic diseases doubled between 1985 and 2005 with the proportion of patients with four or more chronic diseases increased in this period by approximately 300%.17)
Projected increase in prevalence of chronic diseases
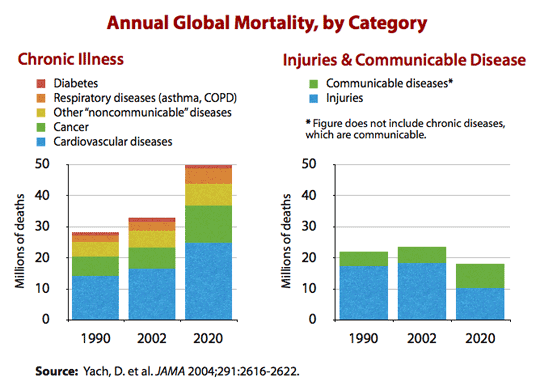
Chronic diseases are the largest cause of death in the world. In 2002, the leading chronic diseases—cardiovascular disease, cancer, chronic respiratory disease, and diabetes—caused 29 million deaths worldwide.18) Worldwide annual mortality due to chronic disease is expected to increase in real numbers as well as relative to deaths from injuries and diseases traditionally understood to be infectious such as polio, rubella, tuberculosis, etc.
In the United States, the number of people with chronic conditions is projected to increase steadily for the next 30 years.19) Partnership for Solutions National Program Office estimates that it will reach 157 million by 2010 while another estimate says that figure will be 140 million.

Specific diseases
- pre-term delivery – The U.S. National Center for Health Statistics (Centers for Disease Control and Prevention) has reported a 20% increase (from 10.6% to 12.7%) in the percentage of preterm deliveries during the years 1990–2005.20)
- stroke – A 2009 descriptive study (no controls) by a group at the Washington University School of Medicine, reports that the age at which their patients are having a stroke has significantly declined.21)
Obesity
Obesity rates worldwide have doubled in the last three decades, even as blood pressure and cholesterol levels have dropped, according to several studies published in a 2011 issue of Lancet.22) In 1980, about 5 percent of men and 8 percent of women worldwide were obese. By 2008, the rates were nearly 10 percent for men and 14 percent for women. That means 205 million men and 297 million women were obese. An additional 1.5 billion adults were overweight.
Another team concluded in a recent meta-analysis that if Americans keep gaining weight at the current rate, 75 percent of U.S. adults will be overweight and 41 percent obese by the year 2015. A 2002 paper concluded that “the prevalence of obesity is increasing globally, with nearly half a billion of the world’s population now considered to be overweight or obese.”23)
Obesity is likely to continue to increase, and if nothing is done, it will soon become the leading preventable cause of death in the United States.
Youfa Wang, MD, PhD 24)
Diabetes
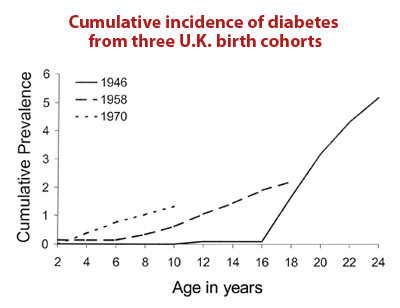
In a 2010 paper, Boyle predicted that one-third of the U.S. population will have diabetes by 2050. In a 2002 paper, Edwin Gale concluded that the incidence of childhood diabetes (type I diabetes) began to steadily increase at almost the same time – from the 1950s onwards.25) This increase had been identified in a range of developed countries including the United States, Sardinia, and Northern Europe.26)
According to a 2009 paper in Diabetes care, the number of people with diabetes in the United States is expected to double over the next 25 years. That would bring the total by 2034 to about 44.1 million people with the disease, up from 23.7 million today.27)

Depression and other mental disorders
Psychiatric disorders which are on the increase globally, already rank among the leading causes of disability, and are expected to take over first place within the next few years. Indeed, the World Health Report 2001 cites depression as causing the largest amount of disability worldwide and in 2004 Ustun stated that depression was the fourth leading cause of disease burden but represents the largest amount of non-fatal burden globally.28) Further, a study of mood disorders among the populations in 30 European countries estimates that, in a typical year, about 165 million people — 38% of the total population of these countries — will have a fully developed mental illness.29)
Chronic fatigue syndrome, fibromyalgia, and multiple chemical sensitivity
According to the 2010 Canadian Community Health Survey (CCHS), the number of Canadians reporting a diagnosis of Chronic Fatigue Syndrome, Fibromyalgia and Multiple Chemical Sensitivities has increased markedly since 2005.
| CCHS 2005 | CCHS 2010 | % change | |
|---|---|---|---|
| Chronic Fatigue Syndrome | 333,816 | 413,370 | 24% |
| Fibromyalgia | 389,782 | 446,586 | 15% |
| Multiple Chemical Sensitivities | 598,585 | 784,798 | 31% |
| Target Population | 27,125,065 | 28,890,710 | 7% |
Cardiovascular disease
It has been predicted that atherosclerosis will be the primary cause of death in the world by 2020.30)
Celiac disease
An article in the N.Y.Times magaine section of 27 Nov.2011 'Should-We-All-Go-Gluten-Free' showed Celiac disease has quintupled between the 1950s and 1990s.
Low levels of 25-D as a proxy for disease
Related article: Diseases associated with low levels of 25-D
Members of societies that do not supplement their food chains with vitamin D have naturally low levels of 25-hydroxyvitamin D (25-DThe vitamin D metabolite widely (and erroneously) considered best indicator of vitamin D "deficiency." Inactivates the Vitamin D Nuclear Receptor. Produced by hydroxylation of vitamin D3 in the liver.).31) 32) However when whole populations are given large amounts of vitamin D, the only members of that population who remain “deficient” are those whose immune systems are fighting disease by actively downregulating 25-D. In other words, the more rigorously vitamin D is added to milk, juice, snack bars, and breakfast cereals, the less likely it is that someone has low levels of vitamin D but no chronic disease.
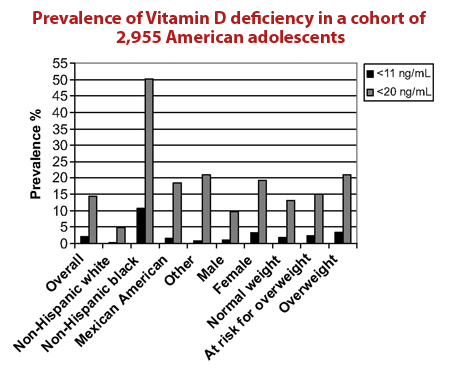
For this reason, data which identifies vitamin D “deficiency” is actually pointing to incidence of disease. In a 2009 paper, Saintonge et al showed that the prevalence of low levels of 25-D - and therefore the rate of chronic disease - is between 2% and 14% among a cohort of 2,955 Americans 12 to 19 years of age.33)
According to Dr. Roger Bouillon of the University of Leuven, “over one billion” people worldwide have vitamin D “deficiency.”34)
The accuracy of this estimate is debatable. If this figure includes those populations that do not supplement with vitamin D, Dr. Bouillon's figure may be an overestimate: healthy people who do not supplement with vitamin D have naturally low levels of 25-D. However, it does seem likely that a large fraction of the world's population suffers from chronic disease of one kind or another.
A study published in 2008, controlling for age and other factors, found that Americans' serum levels of 25-D declined “5-9 nmol/L” in 1988-1994 as compared to 2000-2004 in most males, but not in most females.35) A 2010 study found that 90% of the pigmented populace of the United States (Blacks, Hispanics, and Asians) and nearly 75% of the white population have levels of 25-D lower than 30 ng/ml. This proportion has doubled in these same population within the last 10 years.36)
Factors driving chronic disease
While it has been widely hypothesized that lifestyle factors, including a poor diet and a lack of exercise, are driving what the World Health Organization has termed “an obesity epidemic,” even the most ambitious obesity intervention programs, which have gone to great lengths to increase rates of exercise and improve eating habits of a population, have been failures.37) 38) Obesity and Overweight fact sheet
According to the Marshall Pathogenesis, the primary cause of chronic inflammatory disease is microbes and factors which directly influence pathogens. Indeed, there is growing evidence that chronic diseases are not due to predominantly lifestyle factors. A number of factors have contributed to the creation of an epidemic of Th1 inflammatory diseases.
Infectious burden
As discussed in the article Mistaking correlation for causation in vitamin D studies, observational studies are inherently problematic. However, there is a trove of research that suggests that pathogens play a key role in everything from rate of mortality to intelligence to whether a society chooses facist or democratic rule.
- mortality and morbidity among historical English cohorts – In a 2004 Science paper, Finch and Crimmins proposed that one of the major driving factors behind mortality at all ages was infection and inflammation. The team pointed to studies of historical cohorts in England and Sweden showing that as rates of mortality at younger ages improved in groups born in different years, the adult survivors in those cohorts also had lower rates of mortality and disease. While others have concluded that improvements in sanitation, nutrition, income, and medicine are the driving factors behind historical difference in mortality across all age groups across the last two centuries, Finch and Crimmins argue one of the principal factors, was the difference in “lifetime exposure to infectious diseases and other sources of inflammation,” which they said makes “an important contribution” to the change in disease. Early infections, they said, afflicted survivors with a “cohort morbidity phenotype” which they carried with them throughout their lives.39)
- arteriosclerosis among American blacks and whites – Costa et al. concluded that the difference in the rate of arteriosclerosis (hardening of the arteries) between older blacks from 1910 and older whites from 2004 was due to the discrepancy in infectious burden between the two populations.40)
- longevity among 19th/20th century Northern Europeans – Early-life infection may also explain effects of the season of birth on longevity. Among birth cohorts of the 19th and early 20th centuries from Northern Europe, those born in the spring eventually lived 3 to 6 months longer than autumn births, with corresponding differences in some later-life diseases.41) Fitch and Crimmins attribute this discrepancy to infections, which tend to be higher during winter months.42)
- malaria among Mexicans – Venkataramani studied the effect of malaria on IQ in a sample of Mexicans. Exposure during the birth year to malaria eradication was associated with increases in IQ. The author suggests that this may be one explanation for the substantial increase in average scores on intelligence tests all over the world (known as the Flynn effect) and that this may be an important explanation for the link between national malaria burden and economic development.
- parasite prevalence and worldwide distribution of IQ – Eppig et al. performed a broad analysis of the relationship between average intelligence and parasite load. Using three measures of average national intelligence quotient (IQ), the team found a robust worldwide (as well as within five of six world regions) inverse correlation between intelligence and infectious burden. According to their analysis, infectious disease remains the most powerful predictor of average national IQ when temperature, distance from Africa, gross domestic product per capita and several measures of education are controlled for. The team theorizes, “From an energetics standpoint, a developing human will have difficulty building a brain and fighting off infectious diseases at the same time, as both are very metabolically costly tasks” and that “the Flynn effect may be caused in part by the decrease in the intensity of infectious diseases as nations develop.”43)
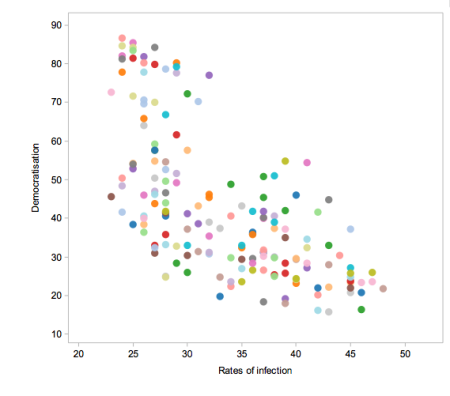
- pathogen prevalence may influence social conformity and choice of a political system – As described in New Scientist, Murray and Schaller examined four sets of data, by country including: results from behavioral conformity experiments, percentage of the population who prioritize obedience, prevalence of left-handedness, and pathogen prevalence.44) Conformity and obedience were both positively correlated with pathogen prevalence and left-handedness was inversely correlated. Evolutionary biologists Thornhill and Fincher explain this result with their parasite-stress model. According to their theory, the nature of the political system that holds sway in a particular country - whether it is a repressive dictatorship or a liberal democracy - may be determined in large part by a single factor: the prevalence of infectious disease. In a region where disease is rife, they argue, fear of contagion may cause people to avoid outsiders, who may be carrying a strain of infection to which they have no immunity. Such a mindset would tend to make a community as a whole xenophobic, and might also discourage interaction between the various groups within a society - the social classes, for instance - to prevent unnecessary contact that might spread disease. For example, a 2008 study tested the idea that societies with more pathogens would be more collectivist. The researchers rated people in 98 different nations and regions, from Estonia to Ecuador, on the collectivist-individualist scale, using data from questionnaires and studies of linguistic cues that can betray a social outlook. Sure enough, they saw a correlation: the greater the threat of disease in a region, the more collectivist people's attitudes were.45) A study soon followed showing similar patterns when comparing US states. In another paper The team's results, published in 2009, showed that each measure varied strongly with pathogen prevalence, just as their model predicted.46) Importantly, the relationship still holds when you look at historical records of pathogen prevalence though not with the prevalence of diseases transmitted directly from animals to humans, like rabies. Since collectivist behaviors would be less important for preventing such infections, this finding fits with Thornhill and Fincher's hypothesis. The team's 2010 paper that used more detailed data of the diseases prevalent in each region. They again found that measures of collectivism and democracy correlate with the presence of diseases that are passed from human to human. This, together with those early psychological studies of immediate reactions to disease, suggests it is a nation's health driving its political landscape, and not the other way around.
Misuse of antibiotics
- Availability and widespread use of antibiotics which promote the bacterial transition to intracellular. The Beta-lactam antibiotics, namely the penicillins (e.g. amoxycillin and cephalosporins) foster the growth of l-form bacteriaDifficult-to-culture bacteria that lack a cell wall and are not detectable by traditional culturing processes. Sometimes referred to as cell wall deficient bacteria..
- Public policy which frowned upon using secondary antibiotics, such as minocycline which could have helped by killing the L-formsDifficult-to-culture bacteria that lack a cell wall and are not detectable by traditional culturing processes. Sometimes referred to as cell wall deficient bacteria. created by the Beta-lactam usage.
- The communication of the L-form bacteria through the food chain from animals routinely treated with antibiotics
Vitamin supplementation
- 'Vitamin' D supplementation of baby food and also of the general food chain.
- Supplementation with folic acid
Immunomodulatory or immunosuppressive agents
- Routine interference with immune reactions: anti-inflammatories, anti-bacterials, corticosteroidsA first-line treatment for a number of diseases. Corticosteroids work by slowing the innate immune response. This provides some patients with temporary symptom palliation but exacerbates the disease over the long-term by allowing chronic pathogens to proliferate., TNF-alpha drugs, etc.
- The rise of the sun-loving culture in the 50s. Prior to the bikini, it was not so fashionable for the young to sunbathe excessively.
Novel vectors for sharing pathogens
- Widespread adoption of compulsory mass vaccinations may play some role although evidence for this is still preliminary and, in some cases, contradictory
- Blood transfusions especially in elective surgery
War
Main article: War – a crucible for chronic disease
War offers a number of circumstances which contribute to the incidence and prevalence of chronic disease as evidenced by epidemiological studies. Circumstances include:
- Acquisition of new pathogens
- Physical trauma and stress
- Psychological stress
Perhaps it is more than coincidence that those diseases for which there is a demonstrated association with war – cancers, hypertension, obesity, and many of the other forms of cardiovascular disease – saw an increase in the aftermath of World War II, particularly in the United States. Given the discrepancy with which the genders have traditionally enlisted, it would be speculative to suggest that war plays a role in the onset of predominantly “male” chronic diseases, but that possibility may be worth further study.
Economics
Market for health care in the United States
In recent years, there has been a dramatic increases in the incidence and prevalence of chronic disease. For this reason, there has been a commensurate increase in the percentage of people who take prescription drugs. Over the last 10 years, the percentage of Americans who took at least one prescription drug in the past month increased from 44 percent to 48 percent, says a 2010 CDC report.
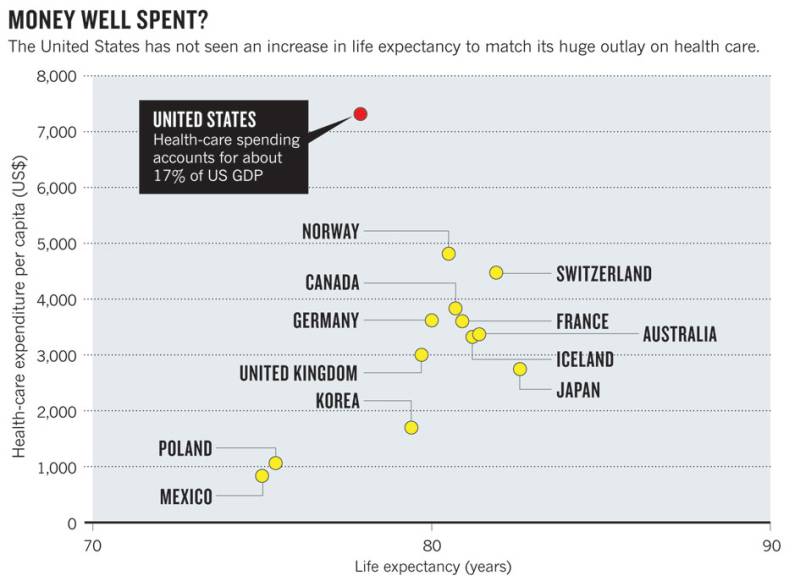
This said, the premium the U.S. spends on health care does not appear to lead to better longevity.47)
Drug development
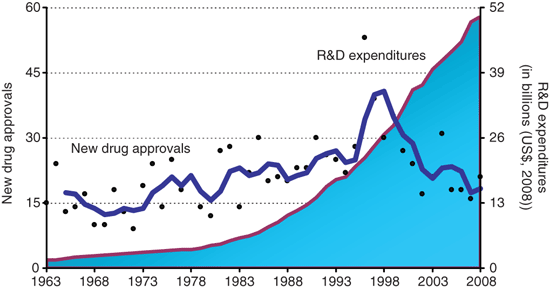
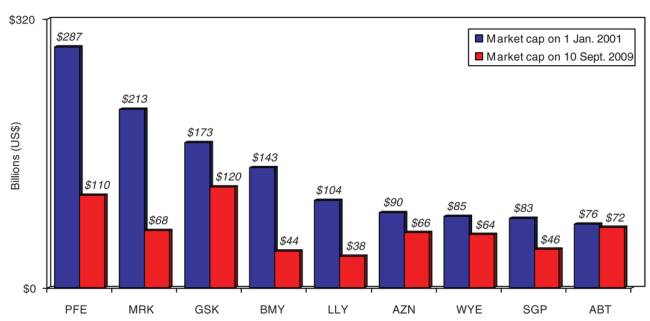
Even though pharmaceutical companies have spent more on the research and development of new drugs, the number of new drugs approved has declined in the last several decades.48)
Meanwhile, the market capitalization of the top-tier pharmaceutical companies has decline. From January 2001 and September 2009, the cumulative loss in market capitalization for these companies over the period is $626 billion.
To state the obvious, these data seems to suggest that new approaches are warranted.
Read more
- Overtreatment is taking a harmful toll – An epidemic of overtreatment is costing the health care system at least $210 billion a year, and patients are paying the price in pain, emotional suffering, severe complications and even death.
[PMID: 10495769]
[PMID: 10938170] [DOI: 10.1001/jama.284.7.831-a]
[PMID: 12701332] [DOI: 10.1038/scientificamerican0503-70]
[PMID: 10963605] [DOI: 10.1038/35021206]
[PMID: 21921876] [DOI: 10.1038/477250a]
[PMID: 15158105] [PMCID: 1497638] [DOI: 10.1016/j.phr.2004.04.005]
[PMID: 20159870] [DOI: 10.1001/jama.2010.104]
[PMID: 22797447] [PMCID: 4083627] [DOI: 10.1001/jama.2012.5265]
[PMID: 17848649] [DOI: 10.1001/jama.298.10.1160-b]
[PMID: 22935268] [PMCID: 3490727] [DOI: 10.1186/1471-2458-12-715]
[PMID: 18949641] [DOI: 10.1080/13814780802436093]
[PMID: 15173153] [DOI: 10.1001/jama.291.21.2616]
[PMID: 18772340] [PMCID: 2543075] [DOI: 10.2353/ajpath.2008.080257]
[PMID: 19785261] [PMCID: 2862359] [DOI: 10.5014/ajot.63.5.621]
[PMID: 12457290] [DOI: 10.1038/sj.ijo.0802209]
[PMID: 17510091] [DOI: 10.1093/epirev/mxm007]
[PMID: 12453886] [DOI: 10.2337/diabetes.51.12.3353]
[PMID: 3317040] [DOI: 10.1056/NEJM198711263172206]
[PMID: 19659751] [DOI: 10.1111/j.1468-1331.2009.02755.x]
[PMID: 19481599] [DOI: 10.1016/j.bbi.2009.05.058]
[PMID: 21896369] [DOI: 10.1016/j.euroneuro.2011.07.018]
[PMID: 21796255] [PMCID: 3141913] [DOI: 10.2147/VHRM.S20737]
[PMID: 17290161] [DOI: 10.1097/GME.0b013e31802c54c0]
[PMID: 16500882]
[PMID: 19255005] [DOI: 10.1542/peds.2008-1195]
[PMID: 19064511] [PMCID: 2745830] [DOI: 10.3945/ajcn.2008.26182]
[PMID: 20133466] [PMCID: 2840860] [DOI: 10.1210/jc.2009-1773]
[PMID: 14594792] [PMCID: 4863237] [DOI: 10.1093/ajcn/78.5.1030]
[PMID: 17028105] [PMCID: 1647320] [DOI: 10.1136/bmj.38979.623773.55]
[PMID: 15375259] [DOI: 10.1126/science.1092556]
[PMID: 17686992] [PMCID: 1948925] [DOI: 10.1073/pnas.0611077104]
[PMID: 12367816] [DOI: 10.1016/s1043-2760(02)00689-6]
[PMID: 20591860] [PMCID: 2992705] [DOI: 10.1098/rspb.2010.0973]
[PMID: 21307175] [DOI: 10.1177/0146167210394451]
[PMID: 18302996] [PMCID: 2602680] [DOI: 10.1098/rspb.2008.0094]
[PMID: 19046399] [DOI: 10.1111/j.1469-185X.2008.00062.x]
[PMID: 21331020] [DOI: 10.1038/470327a]
[PMID: 20130565] [PMCID: 2953249] [DOI: 10.1038/clpt.2009.293]


